I.
Anthony Davis is very good at basketball [citation needed]. One of the major reasons he’s so good — beyond the fact that he’s clearly a basketball-playing alien from the planet Zorblax rather than a human — is his remarkably low turnover rate. He is averaging a very respectable 1.3 turnovers per 36 minutes this season.
You know who else is averaging 1.3 turnovers per 36? DeAndre Jordan. Jordan’s also averaging more rebounds than the Brow, and nearly as many blocks. He’s got a higher true shooting percentage, too. Is Jordan almost as good as Davis? Is he… better?
Of course, I’m deliberately ignoring the biggest difference between Anthony Davis and DeAndre Jordan — the question of usage. Davis takes 17.3 shots from the field and 6.7 from the line per 36; for Jordan, the analogous numbers are 6.6 and 4.1. DeAndre Jordan is a fine player — I’m working on this post while watching Clippers-Rockets, and he’s had some monster dunks — but his offensive role is necessarily limited.
Let’s say that there’s a player — call him, I don’t know, Pendrick Kerkins — who rarely touches the ball on offense, but almost every time he does, he immediately coughs it up. Let’s also make up a player, a ball-dominant point guard named Lamian Dillard, who occasionally loses his dribble or makes a bad pass. It’s clear that Pendrick’s propensity for turnovers hurts his team in a way that Lamian’s averageness doesn’t. But it may be the case that the two players commit very nearly the same number of turnovers per 36 minutes. We need a better statistic.
II.
The standard way around this problem is to calculate turnover percentage — how many turnovers a player commits, as a percentage of the offensive possessions he uses. In the above example, Pendrick Kerkins will have a very high turnover percentage, while Dillard’s will be about average. In the example above that, Anthony Davis is posting a 6.1% turnover percentage on the season; Jordan is at 13%.
Turnover percentage does a pretty good job at solving this problem. But I think it’s incomplete. It doesn’t account for the fact that turnovers can have different outcomes — for example, a pass that gets picked off on the perimeter is going to create more opponent fast-break opportunities than a three-second violation — nor does it account for the fact that turnovers can be a negative side effect of some very good things. This post is about how we might change that.
III.
As of this writing, the qualified player with the lowest turnover percentage of the 2014-15 season is Anthony Morrow. The qualified player with the lowest career turnover percentage is Rasual Butler. Both of those men are way better at basketball than I’ll ever be. What else do they have in common? One thing worth noting is that neither player is exactly a star — both of them have bounced around the league and have rarely started. So certainly low turnover percentage does not an Anthony Davis make.
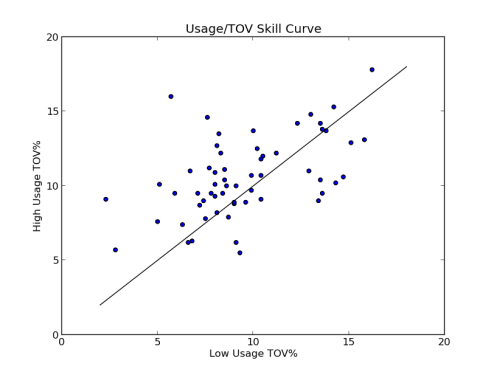
Another thing is that neither Morrow nor Butler is a high-usage player. Is this a universal characteristic of low-turnover players? No! Antawn Jamison, Michael Redd, and LaMarcus Aldridge are the next three players on the career list. Intuitively, it seems as though turnover percentage might increase with increased usage; I used the invaluable nbawowy to find players who had highly different usage rates with other players on and off the floor, and compared their turnover rates:
(data)
There does indeed seem to be an increase in TOV% when players are forced to use more possessions; a paired t-test gave a highly significant result. However, examining season-long USG% and TOV% for players over the past 20 seasons shows a significant negative correlation, with higher usage decreasing turnover percentage; this correlation remains significant and negative even when individual effects are accounted for. Further study is warranted.
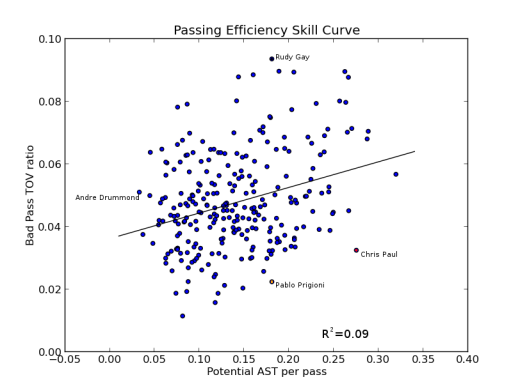
Breaking down turnovers into different types can help us discover more patterns. Seth Partnow demonstrated a relationship between bad-pass turnovers and the proportion of passes that lead to shots; players like Chris Paul and Pablo Prigioni who can create assists without turning the ball over may be especially valuable.
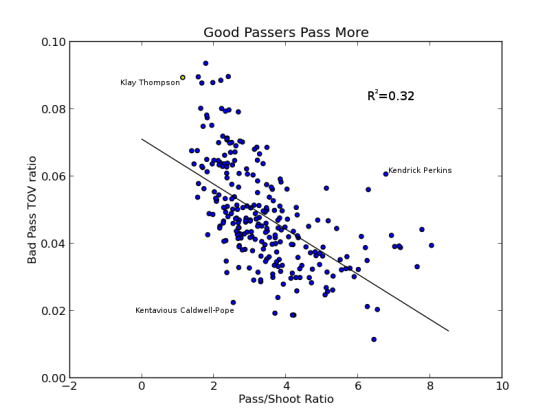
There are other, even stronger relationships, although they are difficult to contextualize as “skill curves” in the same way as the passing efficiency one. For instance, unsurprisingly, players who rarely pass the ball are more likely to make mistakes when they do.
A player like Kendrick Perkins, who rarely ends possessions and commits a high proportion of bad pass turnovers, is especially harmful compared to a shoot-first player like Klay Thompson.
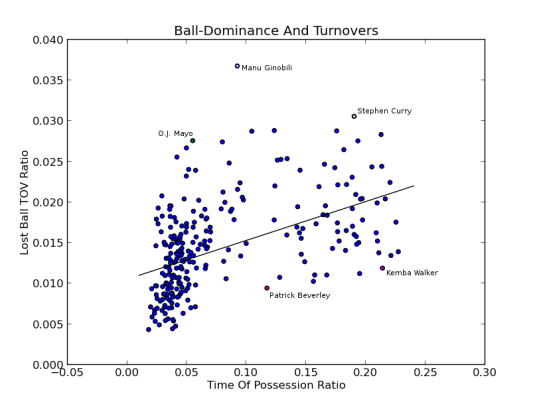
You need the ball to commit lost ball turnovers [citation needed]. (Yes, this is the second time I’ve used that joke in this post. I’m a hack.) Thus the relationship between ball dominance and lost ball propensity is unsurprising:
In particular there are very few players (coughOJMayocough) who play mostly off-ball and commit a large number of lost-ball turnovers; the relationship seems to disappear above a certain threshold of ball-dominance. That said, ball-dominant players like Kemba Walker who maintain low turnover rates may be helpful in preventing teammate turnovers as well as their own.
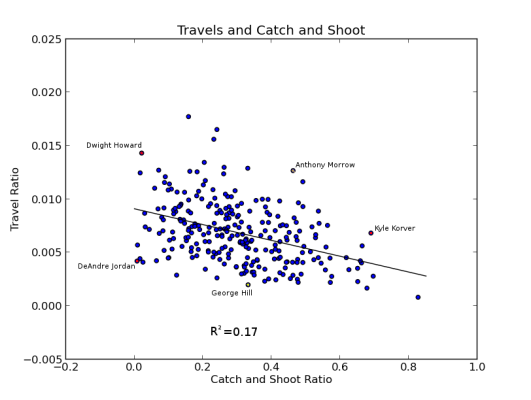
Play style is also correlated with turnover rates in other ways. For example, spot-up shooters who rarely hold the ball long before passing or shooting are unlikely to commit many turnovers. We can see such a strong relationship between the proportion of field goal attempts taken off the catch and travels:
The availability of Synergy data from the NBA stats site will hopefully allow further examination of how play style affects turnovers. For instance, it seems highly likely that post players commit more travels than pure pick-and-roll bigs (see: Dwight Howard vs. DeAndre Jordan). Once again, this will hopefully open avenues to further study.
IV.
So what does this do for us?
For one thing, looking at outliers is always fun. That’s why I’ve highlighted some of them in the above charts. But I think we can do more. A fuller understanding of why players commit turnovers, and what kind, can help us remove noise in turnover percentage, and perhaps develop an XTOV% — expected turnover percentage. This could give us a better idea of to what extent turnover prevention is a skill — and how good Anthony Davis actually is at it. Further, we can develop a general theory of turnover prevention. If Kemba Walker spends a lot of time controlling the ball, and doesn’t commit many turnovers while he does so, is he helping his teammates commit fewer turnovers by keeping them off-ball? If Kyle Korver exerts a major offensive force as a pure catch-and-shoot player, does that help his team avoid turnovers? Does it matter whether Jeff Teague is more like Kemba Walker, or like Manu Ginobili? These are interesting questions. For the best answers, we have to go beyond turnover percentage.
